Creating Dashboards
Now that the charts are built in 'Analyze' module, let us build our first dashboard with a few clicks (again!!).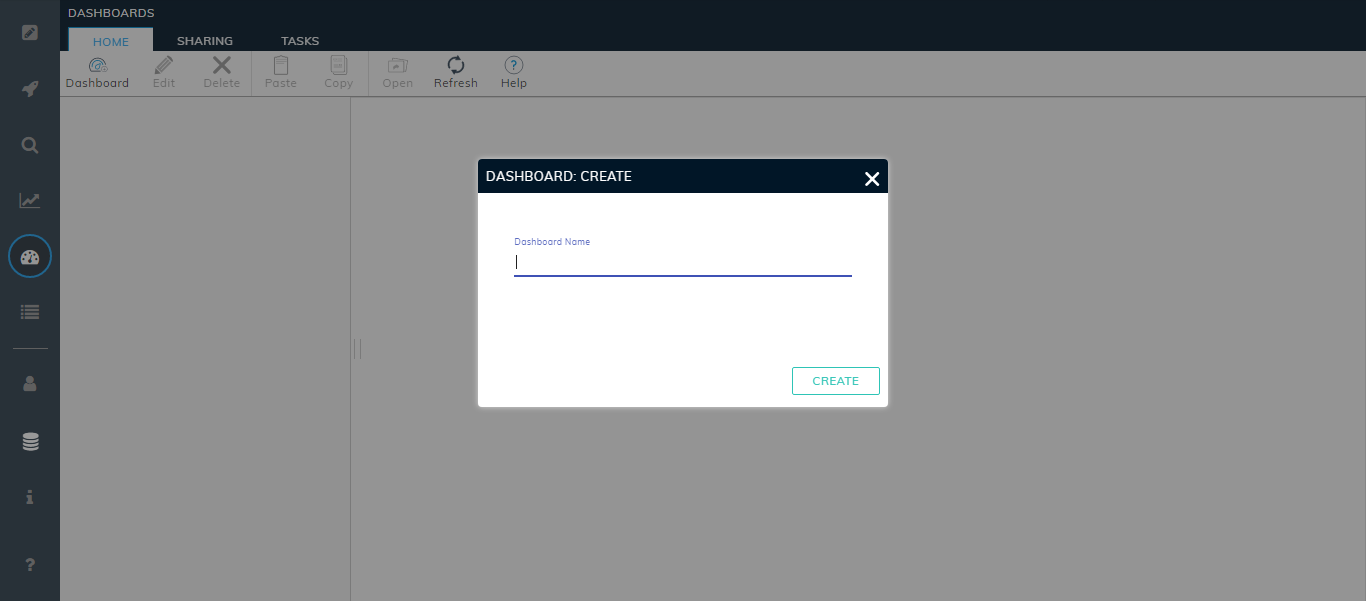


Please click on 'Dashboard', name and 'create' it.
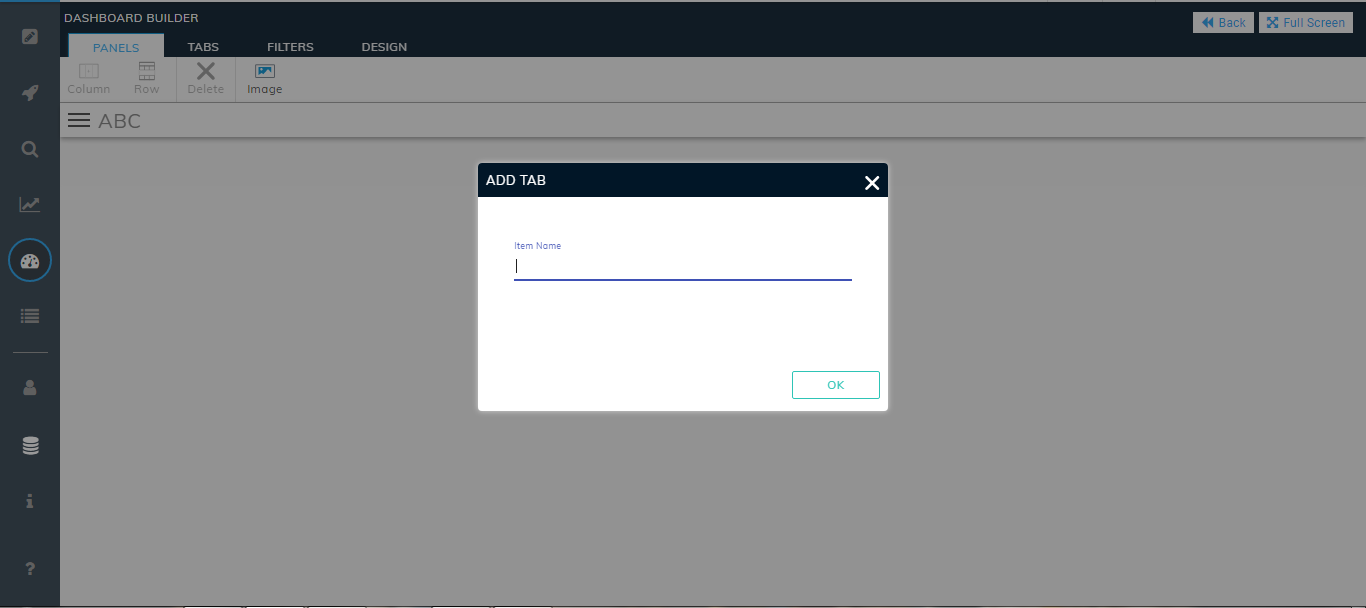
Next click must be on 'Edit'. On prompting, please name your first tab.
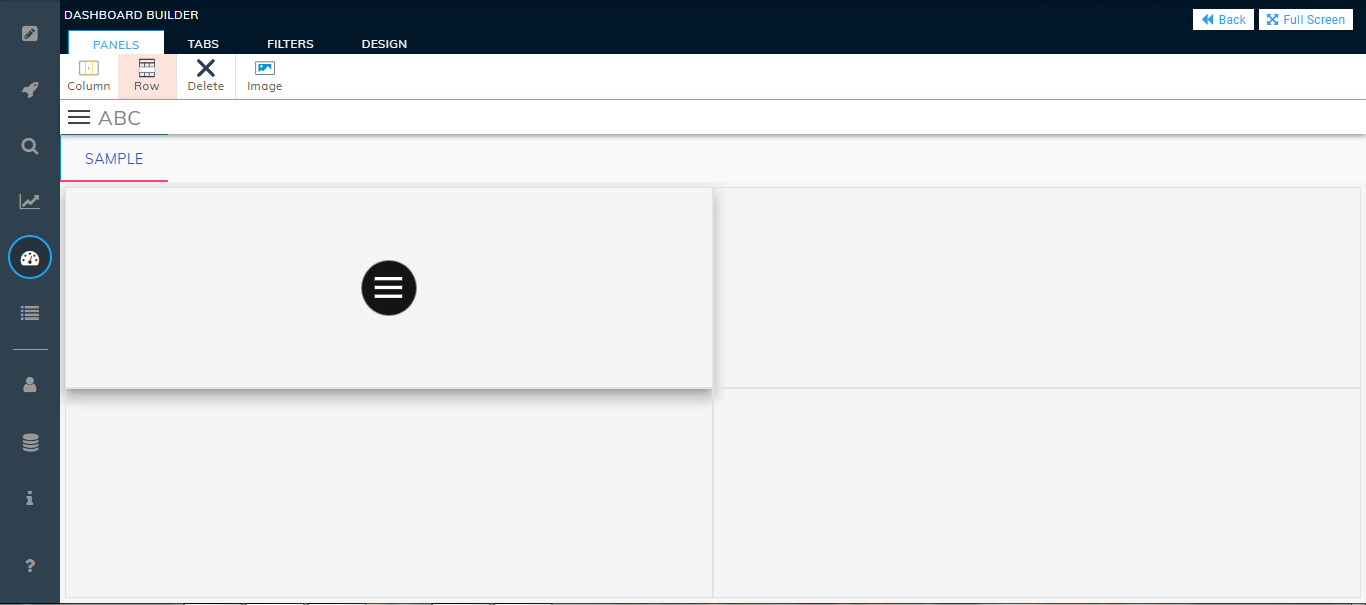
Clicking on the middle of the tab will activate the task-bar.
Divide the tab into columns and rows using 'Panel'.
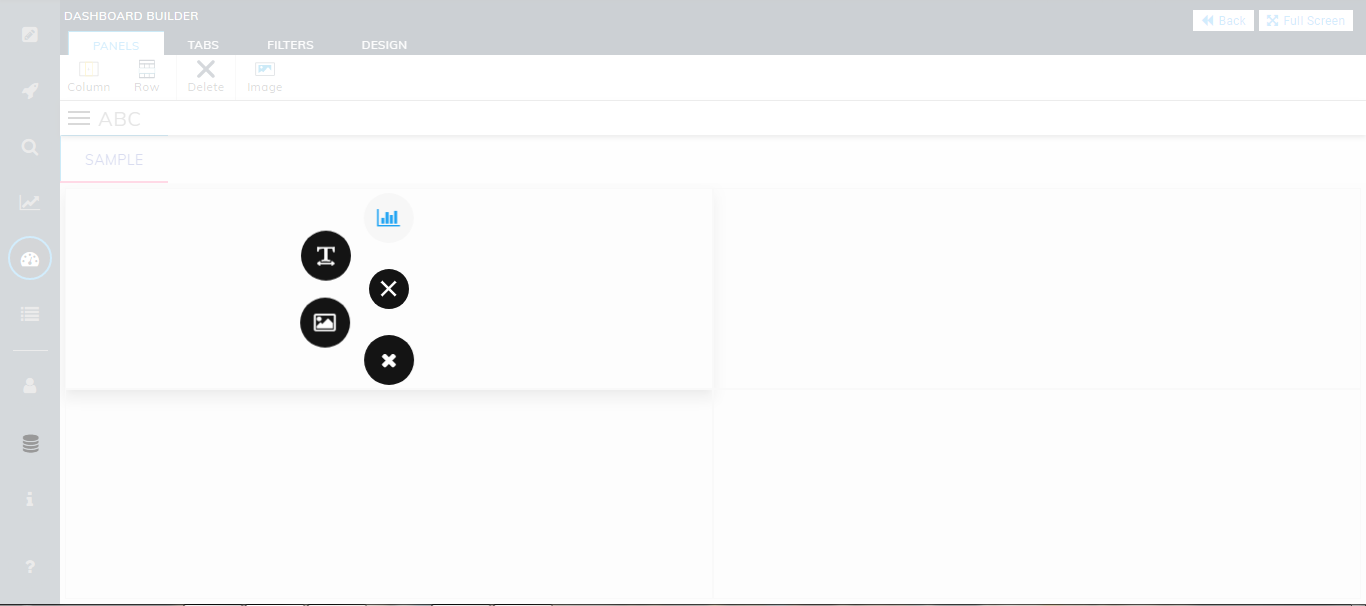
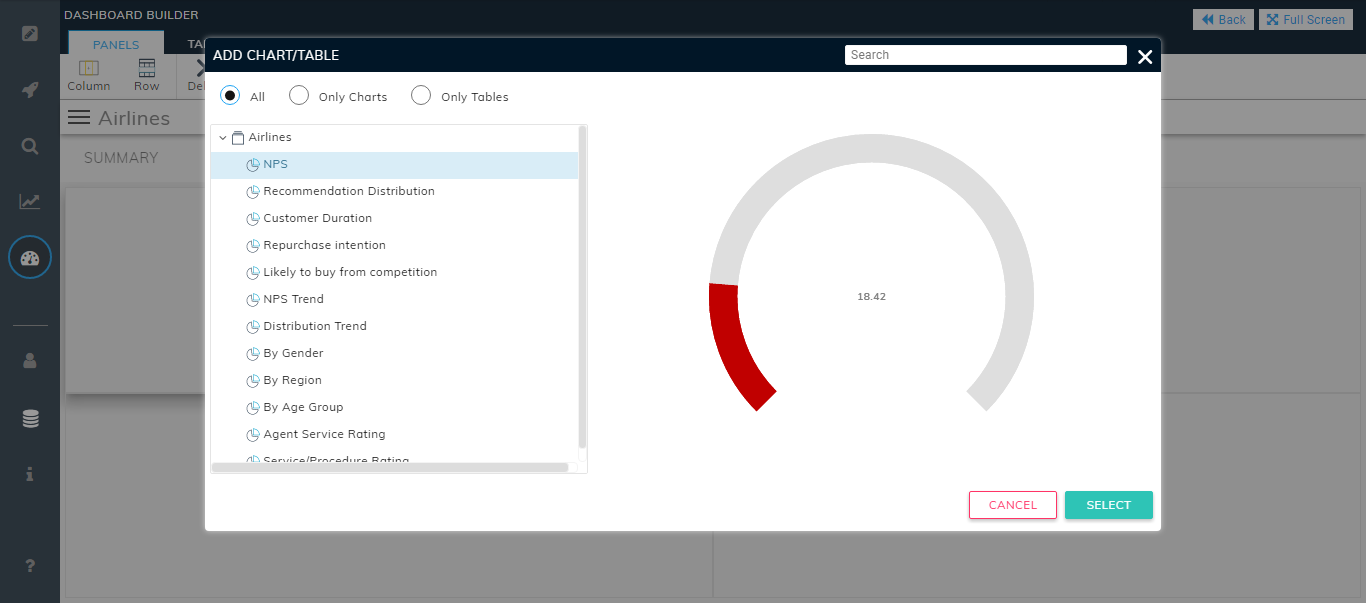
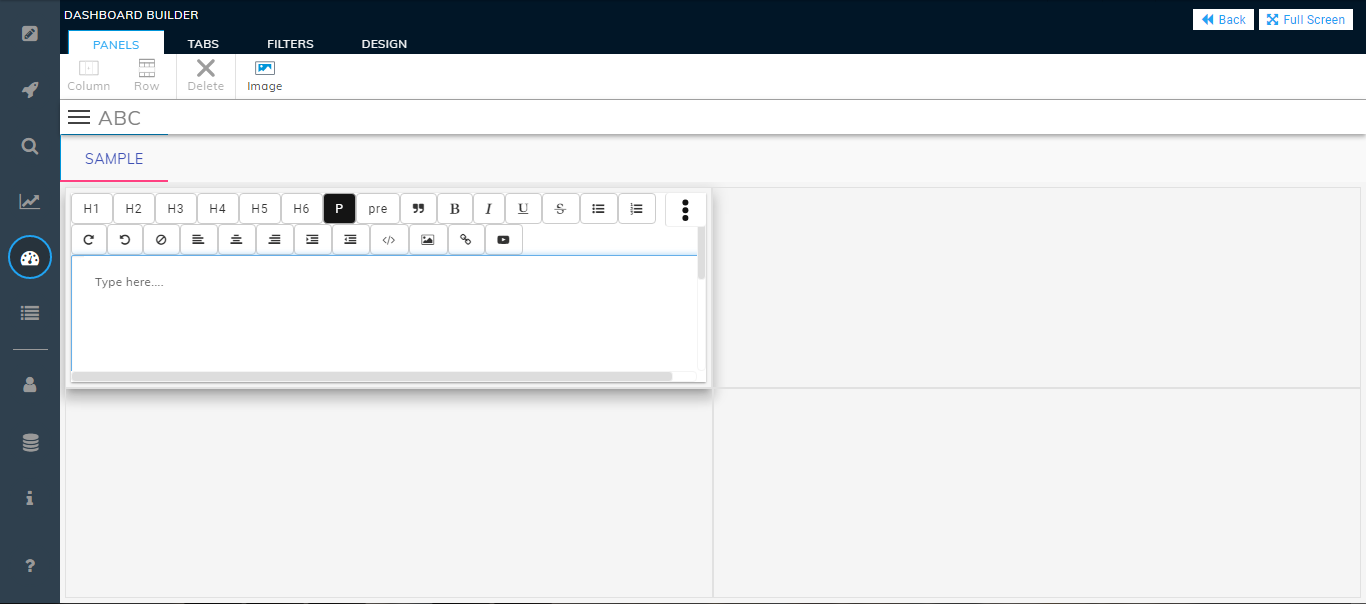
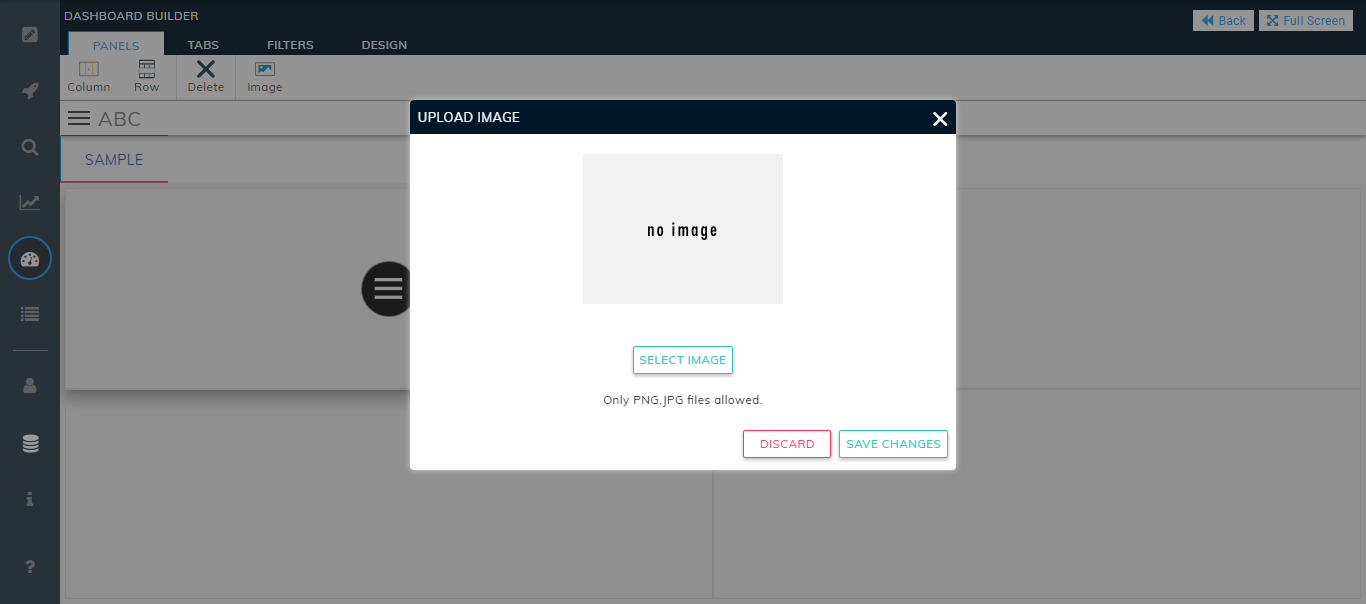
You will be prompted to add Chart, Text Area or image, on clicking the black button in each panel (in above image).
Add Chart from 'Analyze'
Or add Text
Or an image
Don't need a panel? Please'delete' it!
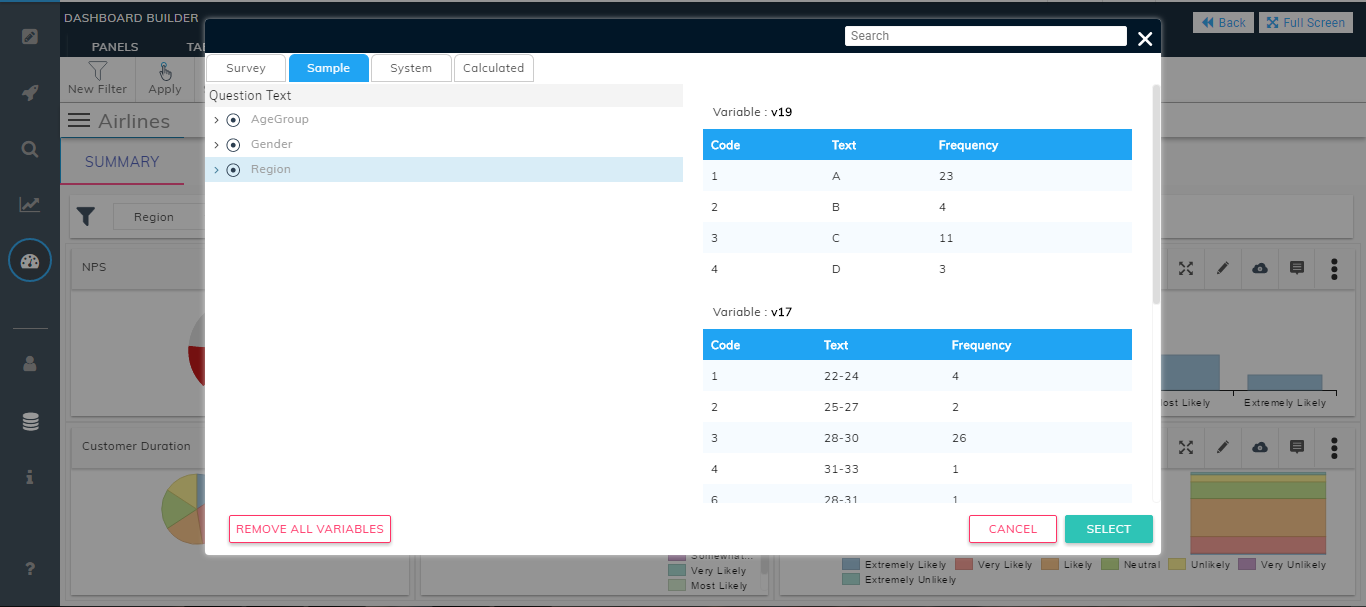
To add 'Filters', please click on 'New Filter', the variable and 'Select' it.
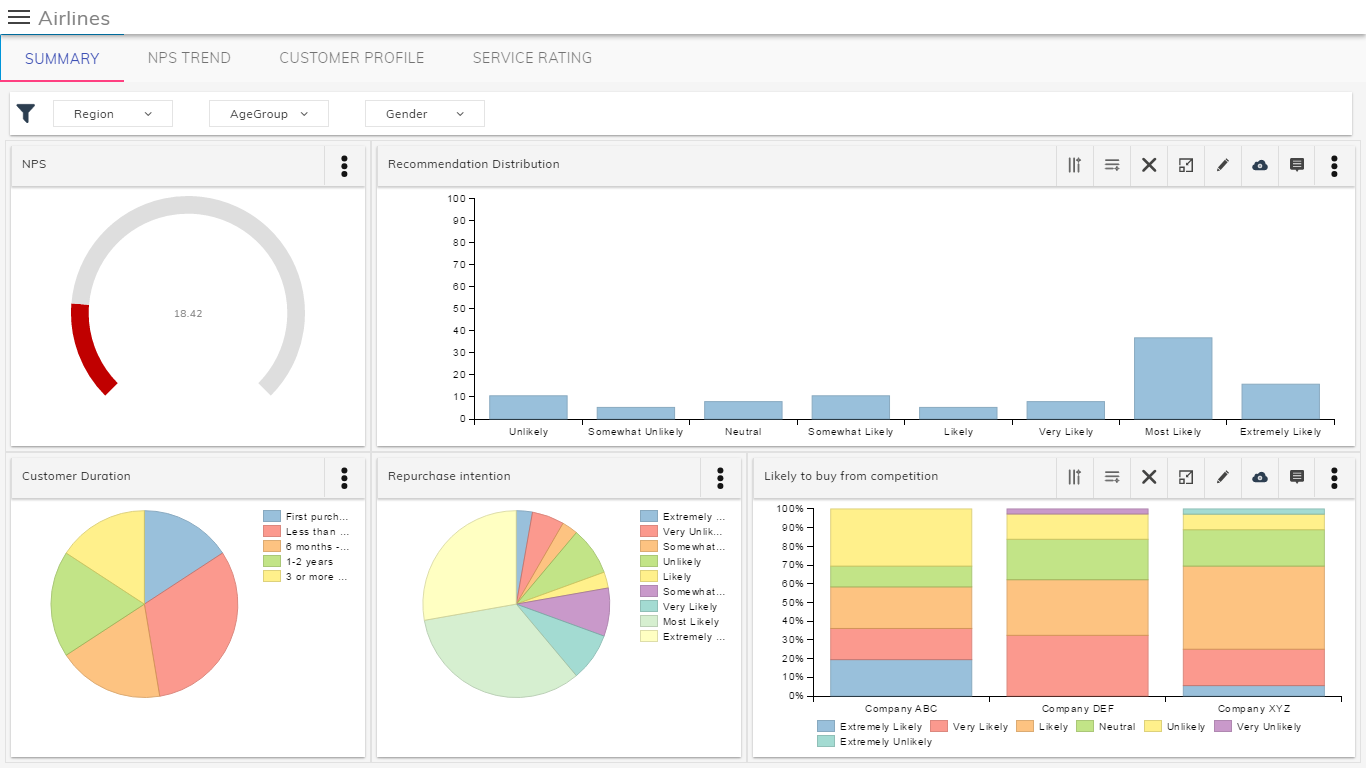
The first tab is built and looks almost like this:
To add more tabs, please click on Tabs, 'New Tab' and repeat the above process.
Related Articles
Creating a Collection
dfCreating your first Survey
While creating a new survey, the default question type will be a Basic single choice radio button question. There are also numerous different question types to choose from. Following question types are available: Basic Choice - Choose One or Choose ...Creating a Campaign
Now that the Distribution List has been finalized, we are all set to distribute the survey. Please click on 'Email Configuration' (after you have closed the Distribution List), to set the sender's email and Name to your liking: Next step is to create ...Creating a Survey from scratch
Creating a survey from scratch is as simple as clicking a few buttons. Once you have successfully logged in to the Consort suite, you will arrive at the Create new surveys page. To create a survey from scratch, click on the Create a new survey ...Creating Folders Inside a Collection
folder